Step 1: Connect your stack
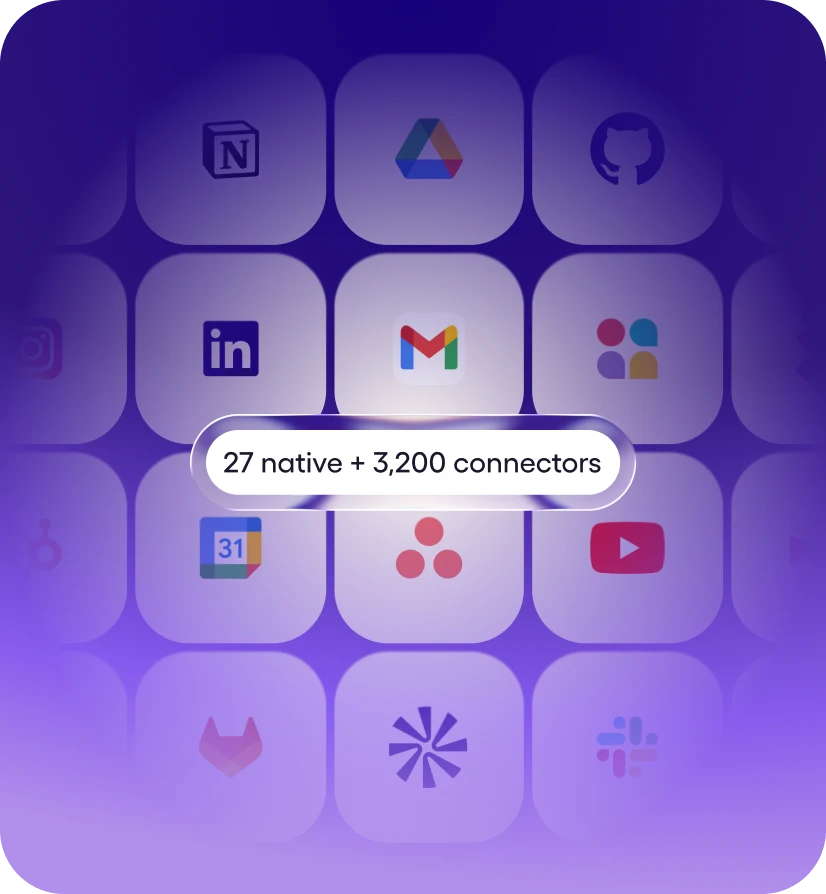
27 native integrations. 3,200+ tools via managed connectors. Most are one-click OAuth, some use API keys - Viktor handles auth and starts working. No webhooks, no Zapier zaps.


Viktor is an AI employee that connects to Grafana and helps you monitor application errors and incidents, running 10 Grafana actions for you like List Folders, Get Dashboard, and Save Dashboard. Ask in plain English from your workspace; Viktor does the work in Grafana and reports back. Viktor connects with a scoped API key.
A Grafana AI agent is an AI that connects to your Grafana account and completes work in it - it doesn't just answer questions about Grafana, it takes the actions. Viktor is an AI employee that works in Grafana on your behalf and delivers the finished result to your workspace.
Unlike workflow builders such as Zapier or Make, there is nothing to configure - no triggers to map, no workflows to maintain. You describe the outcome in plain English, and Viktor picks the right Grafana actions, chains them with the other 3,200+ tools it connects to, and asks for approval before anything sensitive runs.
About Grafana
Open and composable observability platform

You ask in your workspace
Describe what you need in plain English

Viktor picks the actions
Selects from 10 Grafana actions, chains them together

Runs in Grafana
Helps you monitor application errors and incidents - your real data.
Reports back
Delivers the finished result to your workspace
Messages you'd actually send. Paste one into your workspace, swap in your specifics, and Viktor takes it from there.
“Summarize the new errors in Grafana from the last 24 hours and flag any regressions.”
— you, to @Viktor
“Check Grafana for the root cause of last night's incident and report back.”
— you, to @Viktor
“Watch Grafana for a new critical alert and page me immediately.”
— you, to @Viktor
“Post a summary of this week's Grafana incident count to #eng every Friday.”
— you, to @Viktor
27 native integrations. 3,200+ tools via managed connectors. Most are one-click OAuth, some use API keys - Viktor handles auth and starts working. No webhooks, no Zapier zaps.
Message Viktor in Slack like you'd message a teammate. "Reconcile this month's invoices and flag anything weird." "Pause Meta campaigns above $40 CPA and move the budget to winners." Plain English, any tool.
Viktor opens the tools, runs the work, and posts back what changed. Sensitive actions wait for your approval. Everything is logged. You stop doing the work and start reviewing it.
Ask in plain English from your workspace. Viktor picks the right Grafana actions, runs the work, and reports back. No workflows to build.
Search for dashboards by title, tag, or folder. Returns dashboard UIDs, titles, URLs, tags, and folder info. Use the UID with Get Dashboard to retrieve the full dashboard model. Use List Folders to discover folder UIDs for filtering.
Create or update a Grafana dashboard. This is an upsert operation — if the dashboard UID exists, it updates; otherwise it creates. Use Get Dashboard to retrieve an existing dashboard model before modifying it. Use List Folders to find the target folder UID. Pass overwrite: true to force-save over version conflicts.
Execute a query against any configured data source. Use List Data Sources first to discover available data sources and their UIDs. The query language depends on the data source type.
List all dashboard folders. Folders organize dashboards into logical groups. Use folder UIDs with Search Dashboards to filter by folder, or with Save Dashboard to place a dashboard in a specific folder.
List all configured data sources (Prometheus, Loki, InfluxDB, MySQL, etc.), their types, and UIDs. Use the data source UID with Query Data Source to execute queries. The type field indicates what query language to use (e.g., prometheus → PromQL, loki → LogQL, mysql → SQL).
List all alert rules with their current state (firing, normal, pending, inactive). Returns rule definitions including conditions, labels, and annotations. Use this to answer questions like 'what alerts are firing?' or 'what alerts exist for service X?'.
Get the full dashboard model by UID, including all panels, their queries, variables, and configuration. Use Search Dashboards first to find the dashboard UID. The returned model can be modified and saved back with Save Dashboard.
Get the current authenticated Grafana user's identity, including user ID, name, email, organization, and role. Use this to understand the user's permissions and organizational context. The user ID and org context may be needed when creating dashboards or filtering resources.
Permanently delete a Grafana dashboard by UID. This cannot be undone. Use Search Dashboards to find the dashboard UID.
Ask for outcomes that span tools - Viktor pulls from Grafana, cross-references the rest of your stack, and delivers one finished result.
Viktor connects to 3,200+ tools and works across them in a single run.
Yes. Grafana is one of the 3,200+ tools Viktor connects to, via a managed connector. Once connected, anyone on your team can put Viktor to work in Grafana from their workspace - no workflow builder, no code.
One hire. The output of a team.
Viktor works nights, remembers every decision, and connects to 3,200 tools. Start free with $100 in credits, then $50 a month.