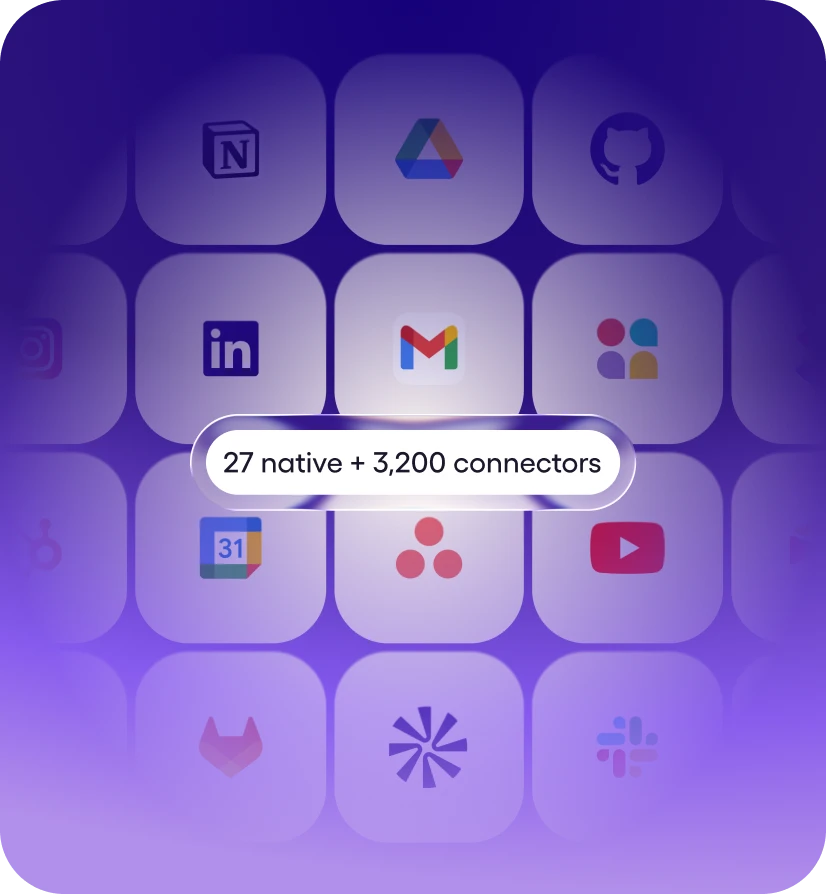
Step 1: Connect your stack
27 native integrations. 3,200+ tools via managed connectors. Most are one-click OAuth, some use API keys - Viktor handles auth and starts working. No webhooks, no Zapier zaps.

Viktor is an AI employee that connects to Datadog and helps you monitor application errors and incidents, running 13 Datadog actions for you like List Logs, Search Logs, and Search Hosts. Ask in plain English from your workspace; Viktor does the work in Datadog and reports back. Viktor connects with a scoped API key.
A Datadog AI agent is an AI that connects to your Datadog account and completes work in it - it doesn't just answer questions about Datadog, it takes the actions. Viktor is an AI employee that works in Datadog on your behalf and delivers the finished result to your workspace.
Unlike workflow builders such as Zapier or Make, there is nothing to configure - no triggers to map, no workflows to maintain. You describe the outcome in plain English, and Viktor picks the right Datadog actions, chains them with the other 3,200+ tools it connects to, and asks for approval before anything sensitive runs.
About Datadog
Cloud monitoring as a service

You ask in your workspace
Describe what you need in plain English

Viktor picks the actions
Selects from 13 Datadog actions, chains them together

Runs in Datadog
Helps you monitor application errors and incidents - your real data.
Reports back
Delivers the finished result to your workspace
Messages you'd actually send. Paste one into your workspace, swap in your specifics, and Viktor takes it from there.
“Summarize the new errors in Datadog from the last 24 hours and flag any regressions.”
— you, to @Viktor
“Check Datadog for the root cause of last night's incident and report back.”
— you, to @Viktor
“Watch Datadog for a new critical alert and page me immediately.”
— you, to @Viktor
“Post a summary of this week's Datadog incident count to #eng every Friday.”
— you, to @Viktor
27 native integrations. 3,200+ tools via managed connectors. Most are one-click OAuth, some use API keys - Viktor handles auth and starts working. No webhooks, no Zapier zaps.
Message Viktor in Slack like you'd message a teammate. "Reconcile this month's invoices and flag anything weird." "Pause Meta campaigns above $40 CPA and move the budget to winners." Plain English, any tool.
Viktor opens the tools, runs the work, and posts back what changed. Sensitive actions wait for your approval. Everything is logged. You stop doing the work and start reviewing it.
Ask in plain English from your workspace. Viktor picks the right Datadog actions, runs the work, and reports back. No workflows to build.
List services from Datadog's Service Catalog with ownership, metadata, and team info. Use to discover service names for filtering in Search Logs (service:my-app) or finding monitors via Search Monitors (tag:service:my-app). Returns service definitions including links, docs, and on-call.
Search Datadog monitors (alerting rules) including status, thresholds, and conditions. Query syntax: tag:env:production, type:metric, status:Alert. Tags filter: comma-separated (e.g. env:prod,team:backend). After finding a monitor, use Search Events to see recent state changes, or Get Metric Data to query the underlying metric it tracks. Returns monitor ID, name, type, query, status, and tags.
Discovery tool: list available Datadog metric names, optionally filtered by host. Returns metric name strings (e.g. system.cpu.user, aws.ec2.cpuutilization) for use in Get Metric Data queries with the syntax aggregation:metric.name{tags}. Use Search Hosts to find valid host names for the host filter.
Search Datadog logs matching a query with support for facets and time ranges. Uses log search syntax: service:web-app status:error, @http.statuscode:>=400, boolean operators (AND, OR, NOT), and wildcards. Set from to now-1h for recent logs. Use Search Metrics to discover metric names or Search Hosts to find host names for filtering. To investigate an incident, use Search Incidents first, then search logs for that time window and service.
Search Datadog incidents by state, severity, and metadata. Query syntax: state:active, state:resolved, severity:SEV-1. After finding an incident, investigate with: Search Logs for the incident time window, Get Metric Data for relevant metrics, Search Events for related monitor alerts, and Search Services for ownership info.
Search monitored infrastructure hosts. Filter by tag (env:production), name (host:web-01), or partial match. Sort by cpu, iowait, load, status, or apps. Host names from results can scope queries in Get Metric Data (e.g. avg:system.cpu.user{host:web-01}), filter logs in Search Logs (host:web-01), or filter metrics in Search Metrics. Max 1000 results.
Search Datadog events: monitor state changes, deployment markers, error spikes, and infrastructure events. Filter by sources (e.g. nagios,docker), tags (e.g. env:prod,service:web), and priority (normal or low). Time range defaults to last 24h (POSIX timestamps in seconds). To investigate a monitor alert, use Search Monitors first, then search events for the relevant time range. Follow up with Search Logs for deeper investigation.
List and search Datadog dashboards. Returns dashboard IDs, titles, URLs, and metadata. Dashboard URL: where region comes from Get Account Info. Use alongside Search Services to find dashboards related to a specific service.
Post custom time-series metric data points to Datadog. Data appears in dashboards, monitors, and can be queried via Get Metric Data. Points: JSON object where keys are Unix timestamps (seconds) and values are numeric, e.g. {"1640995200": 1.0}. Use Search Metrics to verify a metric name exists, or post to a new name to create it. This is a WRITE operation that creates or appends data to a metric time series.
Ask for outcomes that span tools - Viktor pulls from Datadog, cross-references the rest of your stack, and delivers one finished result.
Viktor connects to 3,200+ tools and works across them in a single run.
Yes. Datadog is one of the 3,200+ tools Viktor connects to, via a managed connector. Once connected, anyone on your team can put Viktor to work in Datadog from their workspace - no workflow builder, no code.
One hire. The output of a team.
Viktor works nights, remembers every decision, and connects to 3,200 tools. Start free with $100 in credits, then $50 a month.